BETA — measurements and names under active refinement. Seen a sign, a gate, or a better name? Submit an updateno account needed · photos welcome via GitHub
Every climb on one map
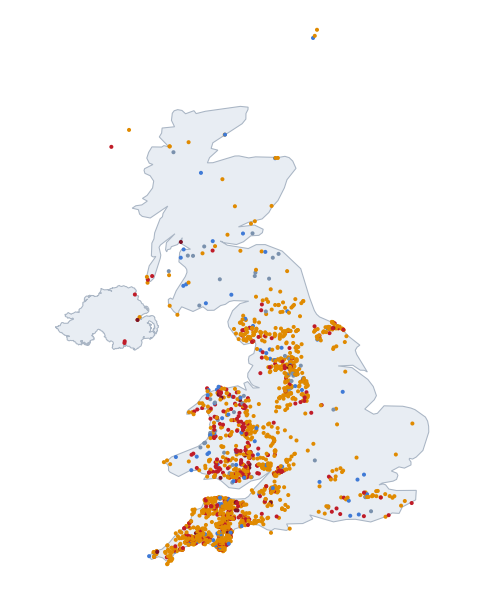
All 1783 published climbs, coloured by their steepest
25 m. Click a dot for the climb’s page. Coverage follows the
open LiDAR record — an empty region usually means missing data,
not missing hills.
The interactive map could not load (the map
library or the basemap tiles are unreachable). The survey’s own
picture of the same climbs:
The two optional layers show the survey behind the
pages: profiled roads carry a full measured gradient ladder but
sit below the page cutoffs (or await review); coarse-only
candidates passed only the 50 m screen — unverified,
some will be terrain-model artifacts. Together they are the ~54,000
roads measured so far; the map is a picture, the tables are the
product.
Coverage footprint — shaded ground is where the survey holds open 1 m LiDAR and has screened every public road: England and Wales as national composites, Scotland where the national programme has published so far, Northern Ireland’s river-basin surveys. Unshaded ground is
where no open 1 m LiDAR was in the record when the survey ran:
not “no hills”, not yet measurable. The footprint is
computed from the survey’s own tile archive, never asserted.
Dot colour: ●
<15% ● 15–20%
● 20–25%
● 25–30%
● 30%+ — steepest
25 m window, the same figure the tables rank by.